fishbone analysis
The fishbone diagram identifies many possible causes for an effect or problem. It can be used to structure a brainstorming session. It immediately sorts ideas into useful categories.
When to Use a Fishbone Diagram
When not to use it:
Fishbone Diagram Example
When to Use a Fishbone Diagram
- When identifying possible causes for a problem.
- Especially when a team’s thinking tends to fall into ruts.
When not to use it:
- The problem is simple or is already known.
- The team size is too small for brainstorming.
- There is a communication problem among the team members.
- There is a time constraint; all or sufficient headcount is not available for brainstorming.
- The team has experts who can fix any problem without much difficulty.
- Agree on a problem statement (effect). Write it at the center right of the flipchart or whiteboard. Draw a box around it and draw a horizontal arrow running to it.
- Brainstorm the major categories of causes of the problem. If this is difficult use generic headings:
- Methods
- Machines (equipment)
- Manpower (people)
- Materials
- Measurement
- Mother nature (environment)
- Write the categories of causes as branches from the main arrow.
- Brainstorm all the possible causes of the problem. Ask: “why does this happen?” As each idea is given, the facilitator writes it as a branch from the appropriate category. Causes can be written in several places if they relate to several categories.
- Again ask “why does this happen?” about each cause. Write sub–causes branching off the causes. Continue to ask “Why?” and generate deeper levels of causes. Layers of branches indicate causal relationships.
- When the group runs out of ideas, focus attention to places on the chart where ideas are few.
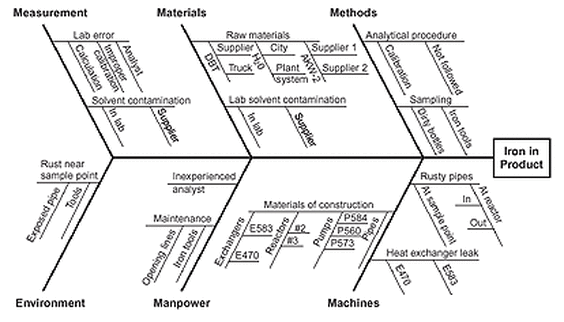
Fishbone Diagram Example
- This fishbone diagram was drawn by a manufacturing team to try to understand the source of periodic iron contamination. The team used the six generic headings to prompt ideas. Layers of branches show thorough thinking about the causes of the problem.
- For example, under the heading “Machines,” the idea “materials of construction” shows four kinds of equipment and then several specific machine numbers.
- Note that some ideas appear in two different places. “Calibration” shows up under “Methods” as a factor in the analytical procedure and also under “Measurement” as a cause of lab error. “Iron tools” can be considered a “Methods” problem when taking samples or a “Manpower” problem with maintenance personnel.
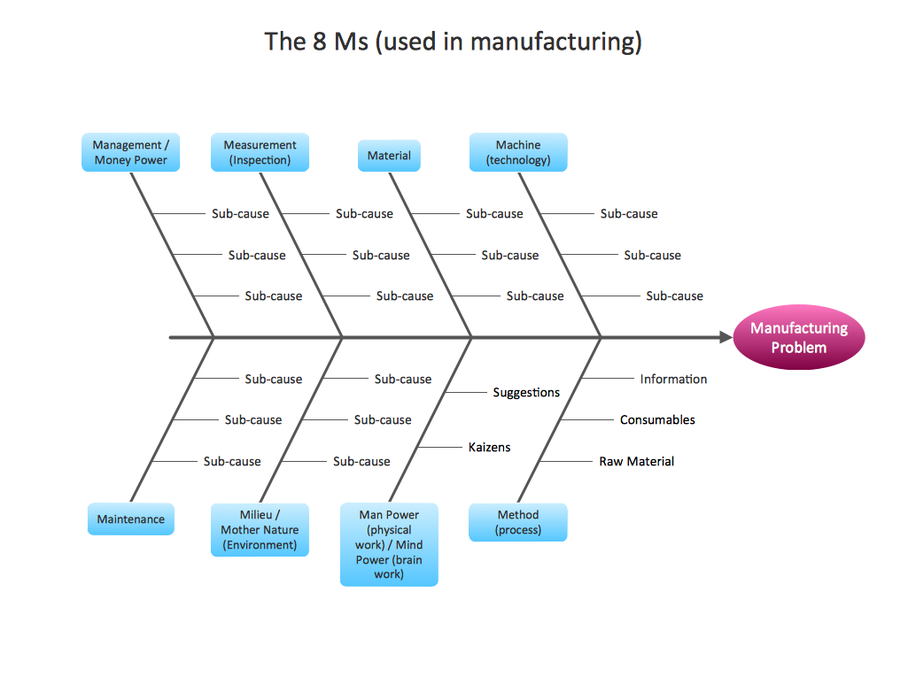
The generic headings can be remembered as the 8 Ms (not all 8 are shown in the diagram above) as shown in the example below.